
MACD on stock Market

The Moving Average Convergence Divergence (MACD) is a popular technical analysis indicator used in stock trading to identify potential buy and sell signals. Here’s a detailed explanation of MACD and how it is used:
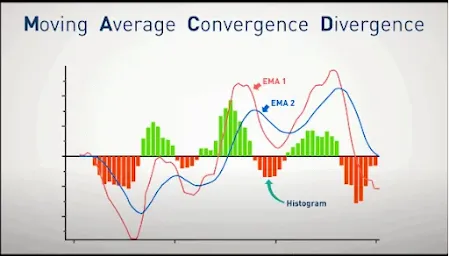
Components of MACD
MACD Line: This is the difference between the 12-day Exponential Moving Average (EMA) and the 26-day EMA.
Signal Line: This is the 9-day EMA of the MACD Line. It is used as a trigger for buy and sell signals.
Histogram: This represents the difference between the MACD Line and the Signal Line. It helps to visualize the strength of the buy or sell signals.
How MACD is Used
Buy Signal: A buy signal is generated when the MACD Line crosses above the Signal Line. This indicates that the stock's momentum is shifting upward.
Sell Signal: A sell signal is generated when the MACD Line crosses below the Signal Line. This suggests that the stock's momentum is shifting downward.
Zero Line Crossover: When the MACD Line crosses above the zero line, it indicates a bullish trend, whereas crossing below the zero line indicates a bearish trend.
Divergence:
- Bullish Divergence: Occurs when the stock price makes a new low while the MACD Line makes a higher low, indicating potential upward reversal.
- Bearish Divergence: Occurs when the stock price makes a new high while the MACD Line makes a lower high, indicating potential downward reversal.
Practical Example
Let's say you are analysing the stock of a company using the MACD indicator.
- If the MACD Line (blue) crosses above the Signal Line (red), you might consider this a buy signal, anticipating that the stock price will increase.
- If the MACD Line crosses below the Signal Line, you might consider this a sell signal, expecting the stock price to decrease.
Interpretation
- Strength of the Trend: The distance between the MACD Line and the Signal Line represents the strength of the trend. Larger distances indicate stronger trends.
- Trend Reversals: Crossovers of the MACD Line and Signal Line suggest possible trend reversals.
Limitations
- Lagging Indicator: As it relies on moving averages, the MACD is a lagging indicator and may not predict future movements but rather confirm trends.
- False Signals: In volatile markets, the MACD can give false signals due to frequent crossovers.
Conclusion
The MACD is a versatile and widely used indicator in technical analysis that helps traders identify the momentum and potential trend reversals of a stock. It combines elements of both trend-following and momentum indicators, making it a valuable tool for many traders


